U.S. roads during national holidays are notoriously busy. And in 2025, the AAA projects a record-high 81.8 million (1.6 million more than in 2024) Americans will travel over Thanksgiving, perennially exceeding Memorial Day and Independence Day as the busiest travel holiday of the year.
And while the nation’s roads are busy and dangerous across the Thanksgiving holiday period, Thanksgiving is not the most dangerous U.S. holiday. Thanksgiving Day itself is relatively safe and features low crash rates, both nationally and in Fulton County.
This study will outline how Georgia’s roads compare with national trends when it comes to crashes, alcohol-related road incidents, and fatalities during the busiest traffic periods of the year. And we’ll give you the heads-up on when to avoid roads during the holiday season.
Since Thanksgiving is almost here, let’s take a closer look at what you can expect during the upcoming holiday season.
Holiday Travel: What To Expect
In the U.S. in 2024, 70 million people traveled by car during Thanksgiving. With those numbers projected to rise during 2025 and further compound road congestion, it’s worth knowing in advance the busiest holiday traffic windows. According to AAA figures, they are:
- Tuesday 25 Nov (12 pm-9 pm)
- Wednesday 26 Nov (11 am-8 pm)
- and Sunday 30 Nov (11 am-8 pm)
Deloitte’s 2024 Holiday Travel Survey also offers some key insights. Survey data confirms that nearly 50% of Americans plan at least one trip between Thanksgiving and mid-January. Holiday travelers are also taking more and longer trips each year, with the average number of trips per traveler up from 1.88 to 2.14.
Numerous factors contribute to the rising number of travelers. For example, remote workers – comparatively free to travel due to not being tied to a specific location – nowadays average 2.7 holiday season trips. This trend means traditionally ‘off-peak’ days, as well as weekends, are now considerably busier.
Gen Z and Millennial travelers show the largest rise in holiday travel compared to other age groups, while higher-income households (earners of more than a combined $100,000) represent a rising and disproportionate share of holiday trips and spending, including more air as well as road travel.
Holiday traffic issues begin to intensify in earnest well ahead of significant days, with roadside service events notably increasing (by around 20%) on the Monday before Thanksgiving. And airport-access routes are also subject to 20-30 minute delays during peak departure and return periods across Thanksgiving weekend.
It’s important to emphasize the fact that, when it comes to holiday travel, the period before and after momentous days is often when crash danger is at its highest – and that Thanksgiving is not the most dangerous U.S. holiday.
Holiday Road Crash Risk: The Bigger Picture
Study data tells us that, between 2018 and 2022, 11,100 people were killed in crashes during major U.S. holiday travel periods, with the Fourth of July the single deadliest day of the year, accounting for 716 deaths over the five-year window (six people killed every hour). Labor Day was the deadliest holiday during that timeframe (2,462 traffic deaths): Thanksgiving ranked a close second over the same period (2,456 fatalities). Memorial Day ranked third (2,292 deaths).
Although not the most dangerous traffic holiday overall, Thanksgiving is the deadliest holiday for pedestrians, who account for 21% of Thanksgiving-period crash deaths.
On average, U.S. holiday periods represent an elevated traffic fatality risk, and see 123 traffic deaths per day, significantly more (13.9%) than the average 108 deaths that occur on non-holiday days. And alcohol is a major contributory factor, with 38% of traffic fatalities involving alcohol-impaired drivers (slightly less – 35% – over Thanksgiving), compared to 29.7% across non-holiday days. Speeding (31.1%) and distracted driving (7.4%) are also significant holiday-period fatality factors, underscoring how aggressive and unfocused driving compounds holiday road risk.
Despite the number of cars on roads rising during holiday periods, actual crash rates on Thanksgiving Day are expected to be lower than on typical travel days, due to reduced road activity.
If we consider a cross-comparison of countrywide NHTSA/FARS/ValuePenguin data, we can see that the Christmas and New Year holiday in the U.S. is significantly less dangerous than other major holiday periods, despite public perception. Here are the fatality numbers between 2019 and 2023 for major U.S. holiday periods.
| National Holiday | Number of Fatalities |
|---|---|
| Labor Day | 2,521 deaths |
| Thanksgiving | 2,487 deaths |
| Memorial Day | 2,334 deaths |
| Independence Day | 2,189 deaths |
| New Year’s | 1,671 deaths |
| Christmas | 1,703 deaths |
New Year’s Day is the most dangerous holiday of the year for drunk driving. Study data suggests that deaths due to drunk driving increase by 89% above average daily drunk driving fatality rates (with 57% of drunk driving-related fatalities usually occurring over the weekend, Friday through Sunday).
Alcohol-impaired driving is as high over the New Year as at any other time of the year (with Independence Day showing similar rates). Road accidents over New Year are due to drunk driving in 38% of cases; during non-holiday periods, that figure falls to 29.8%, while the holiday period averages 123 drunk driving deaths a day compared to the non-holiday figure of 108 – a 14% spike.
And, according to Deloitte, Christmas traffic volume rises have been compounded by remote workers’ driving habits. While nearly 50% of Americans will take at least one trip between Thanksgiving and mid-January, more flexible remote workers will, on average, take 2.7.
Across all holiday periods, here are the states that suffer the highest danger levels.
State-by-State Holiday Driving Risk (data from FARS between 2018 and 2022)
Most Dangerous States for Holiday Driving (Fatalities per 100,000 Residents)
In the U.S., rural states represent a disproportionate level of danger when we examine holiday traffic fatalities per 100,000 residents. There are a number of reasons for this, though the often remote, widely dispersed locations in question and a comparatively slower emergency response time are the two primary factors.
| State | Holiday Deaths per 100,000 Residents |
|---|---|
| Montana | 6.78 |
| Mississippi | 6.25 |
| Wyoming | 5.88 |
| South Carolina | 5.74 |
| New Mexico | 5.49 |
| Delaware | 5.43 |
| South Dakota | 5.39 |
| Alabama | 5.25 |
| Arkansas | 5.07 |
| Louisiana | 5.04 |
Conversely, here are the top 10 safest states for holiday driving per 100,000 residents.
| State | Holiday Deaths per 100,000 Residents |
|---|---|
| Massachusetts | 1.32 |
| Rhode Island | 1.55 |
| New York | 1.61 |
| Utah | 1.89 |
| Minnesota | 2.04 |
| District of Columbia | 2.09 |
| Washington | 2.15 |
| Hawaii | 2.21 |
| Pennsylvania | 2.22 |
| New Jersey | 2.26 |
There are many different ways of measuring comparative road danger: another is to look at the difference between holiday fatalities versus those occurring during ‘normal’ days.
States Where Holidays Are Especially Dangerous Compared to Normal Periods
| Delaware | 71.4% more deadly |
| District of Columbia | 66.7% more deadly |
| Connecticut | 58.8% more deadly |
| South Dakota | 51.4% more deadly |
| Montana | 49.1% more deadly |
| North Dakota | 40.7% more deadly |
| New Hampshire | 39.4% more deadly |
| New Jersey | 39.2% more deadly |
| Iowa | 38.5% more deadly |
| Idaho | 31.7% more deadly |
Once again, narrowing our focus, here are the most dangerous Thanksgiving states. The states making up the top three spots (with a huge gap between third and fourth spot) are also the most populous states in the country.
| California | 48 (Thanksgiving fatalities between 2018 and 2022) |
| Texas | 47 |
| Florida | 39 |
| N. Carolina | 19 |
| Georgia | 18 |
Most Dangerous Roads During Thanksgiving
According to the National Safety Council, between 2004 and 2023, the following roadways have suffered the most fatalities during the Thanksgiving holidays. Again, the top-ranking results are drawn from busy urban centers.
| 1. I-15 in San Bernardino County, CA | 11 fatalities (population: 2.20M) |
| 2. SR-85 in Okaloosa County, FL | 10 fatalities (population: 220k) |
| 3. I-5 in Los Angeles County, CA | 10 fatalities (population: 9.73M) |
| 4. I-605 in Los Angeles County, CA | 10 fatalities (population: 9.73M) |
| 5. I-10 in Ascension Parish County, LA | 9 fatalities (population: 132k) |
| 6. SR-91 in Indian River County, FL | 9 fatalities (population: 170k) |
| 7. I-8 in Imperial County, CA | 9 fatalities (population: 181k) |
| 8. US-19 in Pinellas County, FL | 9 fatalities (population: 967k) |
| 9. I-15 in Riverside County, CA | 9 fatalities (population: 2.50M) |
| 10. SR-78 in San Diego County, CA | 9 fatalities (population: 3.29M) |
Beyond the danger of accidents and fatalities, no Thanksgiving travelers want to end up stuck in a tailback while on their way to a holiday destination. Here are some examples of the kind of delays you can expect to experience if you use any of the following routes at the wrong time.
Metros’ Holiday Congestion Increases Compared to Typical Congestion
| Metro | Route | Peak Congestion Period | Est. Travel Time | Increase Compared to Typical |
|---|---|---|---|---|
| Washington, DC | Washington, DC to Baltimore via Balt/Wash Pkwy N | Tuesday, 4:30 PM | 1 hour 50 minutes | 166% |
| New York | New York to the Hamptons via Long Island Expy E | Tuesday, 4:30 PM | 4 hours 8 minutes | 163% |
| Los Angeles | Los Angeles to Bakersfield via I-5 N | Wednesday, 7:45 PM | 4 hours 10 minutes | 147% |
| San Francisco | San Francisco to Santa Rosa via US-101 N | Tuesday, 7:15 PM | 2 hours 34 minutes | 114% |
| Boston | Boston to Hyannis via Pilgrims Hwy S | Thursday, 11:45 AM | 2 hours 0 minutes | 108% |
| Philadelphia | Philadelphia to Baltimore/DC via I-95 S | Sunday, 2:15 PM | 2 hours 38 minutes | 85% |
| Tampa | Tampa to Orlando via I-4 E | Friday, 2:45 PM | 2 hours 52 minutes | 85% |
| San Diego | San Diego to Palm Springs via I-15 N | Wednesday, 5:00 PM | 4 hours 49 minutes | 79% |
| Seattle | Seattle to Bellingham via I-5 N | Tuesday, 6:45 PM | 3 hours 22 minutes | 77% |
| Denver | Pueblo to Denver via I-25 N | Tuesday, 5:30 PM | 2 hours 60 minutes | 64% |
| Portland | Portland to Eugene via I-5 S | Friday, 4:00 PM | 2 hours 43 minutes | 61% |
| Chicago | Indianapolis to Chicago via I-65 N | Sunday, 3:45 PM | 4 hours 8 minutes | 57% |
| Atlanta | Atlanta to Savannah via I-16 E | Sunday, 3:30 PM | 5 hours 16 minutes | 53% |
| Minneapolis | Eau Claire to Minneapolis via I-94 W | Sunday, 4:45 PM | 1 hour 49 minutes | 53% |
| Detroit | Kalamazoo to Detroit via I-94 E | Tuesday, 4:30 PM | 2 hours 54 minutes | 48% |
| Houston | Galveston to Houston via I-45 N | Tuesday, 5:30 PM | 1 hour 15 minutes | 47% |
The Black Friday Driving Risk
Black Friday means a shopping deals frenzy – which in turn means far more cars on the road, and far more car accidents. In fact, according to insurance claims data, there are about 34% more car accidents on Black Friday than on other, non-holiday days in late November, the highest one-day spike. Factors that clearly illustrate highly busy stop-start periods of congestion include a rise in phone distractions (by 10%), speeding (11%), and hard-braking incidents (13%).
Additionally, travel times around malls nearly double on Black Friday, especially in the afternoon and evening.
As a comparison against overall Black Friday numbers, during the Wednesday before Thanksgiving, there are 25% more crashes than average, with 20% more on Thanksgiving Day.
Ultimately, holiday roads combine higher travel volume, more risky driving behaviors, and higher levels of alcohol intake, all of which combine to raise crash likelihood during the shopping and party season. And while that’s true across the United States, Georgia state figures feature some notable differences regarding national holiday traffic accident trends.
Georgia Holiday Travel Accident Data
According to traffic data, in Fulton County between 2020 and 2025, there were 312,000 reported crashes and over 900 traffic fatalities. But when we look closely at holiday danger numbers in the state, Thanksgiving features way down the list, with much of its danger occurring both before and after the key occasion date.
Christmas and New Year’s rank surprisingly high in Georgia crash totals. 2024 data confirms 361 car accidents on both Christmas and New Year’s weekend: higher numbers than recorded over Memorial Day, Labor Day, Presidents’ Day, and Independence Day.
Based on AAA/INRIX travel patterns and historic Fulton County crash data, the most dangerous Christmas and New Year driving windows in Atlanta over the 2025 holiday will be as follows.
- Dec 22 to 23 (outbound journeys)
- Dec 26 to 30 (return journeys)
- Jan 1 to 2 (return journeys)
The Top Ten Most Dangerous Holiday Travel Periods in Georgia (2024 figures)
| Rank | Holiday Weekend | Accidents | Notes |
|---|---|---|---|
| 1 | Columbus Day | 403 | Highest annual crash total; early October surge |
| 2 | MLK Jr. Day | 380 | Unusually high for a winter holiday weekend |
| 3 | Veterans’ Day | 373 | Heavy early November weekend traffic volume |
| 4 | New Year’s Weekend | 361 | High DUI risk; similar to Christmas totals |
| 5 | Christmas Weekend | 361 | Driven by holiday gatherings, night travel |
| 6 | Memorial Day | 350 | Steady year-on-year summer danger |
| 7 | Labor Day | 346 | Another high-volume end-of-summer weekend |
| 8 | Independence Day | 317 | High drunk driving numbers, but quite low overall |
| 9 | Presidents’ Day | 298 | Winter weather and school travel contribute |
| 10 | Thanksgiving Weekend | 276 | Lowest count, as most travel is before the weekend |
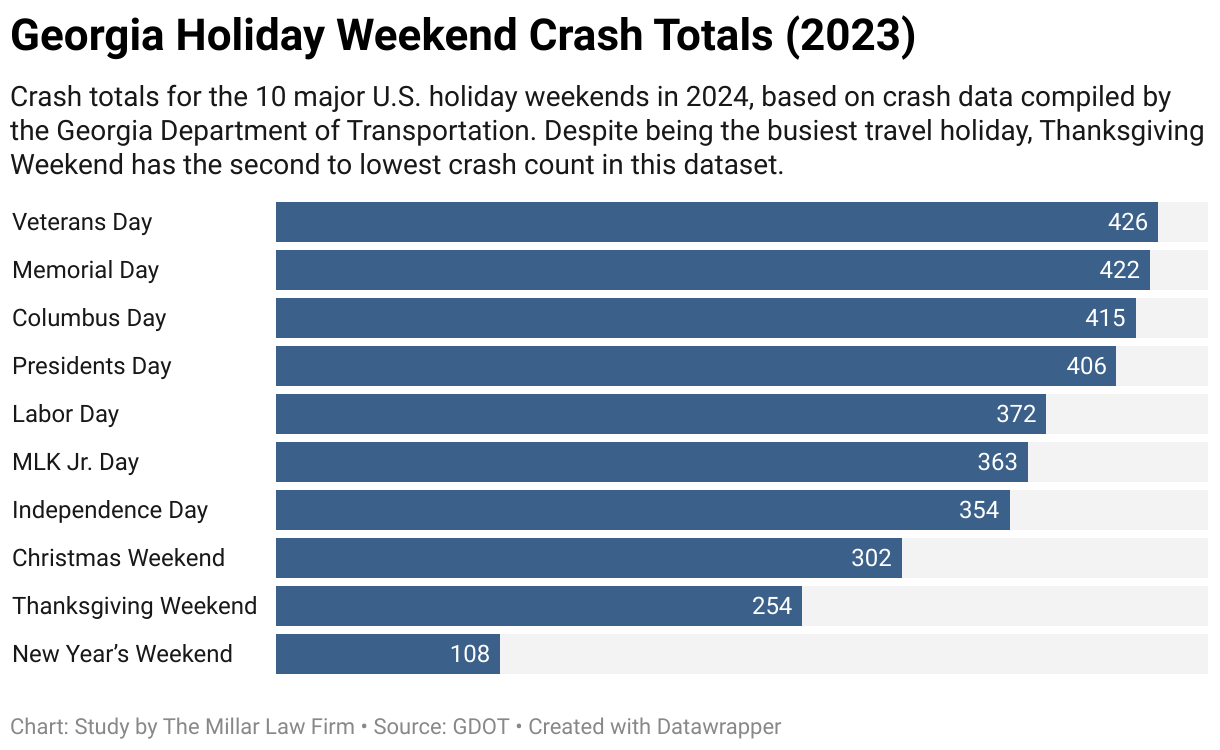
Here are the same ranking figures for the prior year (2023). As a glance can confirm, Thanksgiving once again ranks very low.
| Rank | Holiday Weekend | Accidents | Notes |
|---|---|---|---|
| 1 | Veterans Day | 426 | Highest annual crash total; heavy November surge |
| 2 | Memorial Day | 422 | Consistently one of the deadliest weekends |
| 3 | Columbus Day | 415 | Early fall traffic spike matches the 2024 trend |
| 4 | Presidents Day | 406 | Strong winter accident activity |
| 5 | Labor Day | 372 | Typical end-of-summer congestion levels |
| 6 | MLK Jr. Day | 363 | Unusually high for a mid-winter weekend |
| 7 | Independence Day | 354 | Holiday-related and nighttime crashes inflate totals |
| 8 | Christmas Weekend | 302 | Down slightly from prior years |
| 9 | Thanksgiving Weekend | 254 | Heaviest travel volume, less concentrated over 3 days |
| 10 | New Year’s Weekend | 108 | Only includes Jan 1 weekend |
Thanksgiving in Fulton County
When we look at the accident spread across the full Thanksgiving period (from the Wednesday before to the Sunday after), we can see a perfect illustration of why some enduring myths around Thanksgiving don’t quite stack up. The Wednesday before Thanksgiving in Fulton is consistently the most crash-prone day of the holiday period. This fact matches AAA’s national forecast that pre-holiday outbound traffic represents the worst time to drive.
And as Fulton County patterns show, travel surges between Christmas and New Year holiday days (not the holiday itself) are the main issue, with pre-holiday driving creating spikes equivalent to Dec 23 and Dec 26, and return traffic issues as significant as those over January 1st and 2nd.
Thanksgiving Day itself is the safest day in the five-day window across every single year in the dataset, with crash counts less than half of Wednesday’s totals, primarily due to less traffic on the roads.
Sunday return traffic is volatile (ranging from 88 to 158 crashes over the period), suggesting local risk is volatile and depends on weather, flight schedules, and work/school calendars.
Despite the total Wednesday–Sunday crash count trending down since its 2020 peak, the general pattern of risk across the week hasn’t changed, with a notably big Wednesday spike, a dip on Thursday, and resurgent numbers from Friday through Sunday.
Combining data across all years, the Wednesday before Thanksgiving averages about 160% more crashes than Thanksgiving Day, with the highest differential a 216% increase in 2020.
Further confirmation of the potential danger factor on the Sunday after Thanksgiving can be seen via this comparison table.
| Year | Sunday After Thanksgiving Crashes | Average Sunday Crash Numbers |
|---|---|---|
| 2020 | 158 | 90 |
| 2021 | 100 | 121 |
| 2022 | 143 | 113 |
| 2023 | 97 | 105 |
| 2024 | 88 | 98 |
Although during some years the count on the post-Thanksgiving Sunday is slightly lower than during an average Sunday, on other occasions it far exceeds average crash counts: on nearly all occasions it represents the second-highest dangerous driving day either before or after Thanksgiving. Ultimately, Fulton County’s Thanksgiving road statistics mirror national AAA/INRIX guidance, with the worst days to drive either the Wednesday before or the Sunday after the holiday.
Holiday Travel Across Georgia: Traffic Danger/Delay Hot Spots
Atlanta ranks 7th among major U.S. cities when it comes to holiday fatality rate numbers, with 5.25 holiday deaths per 100,000 residents. As a key regional corridor, Georgia’s roads will be extremely busy during the holiday season. And some traffic spots will be considerably more dangerous and congested than others.
In Atlanta, the I-16 corridor sees extreme congestion, with INRIX/AAA data suggesting that the journey between Atlanta and Savannah via the I-16 can take up to 5 hours and 16 minutes during peak holiday return days: 53% longer than normal travel time.
The I-75 and the Downtown Connector (where I-75 and I-85 run concurrently) represent the most dangerous metro corridor and feature both the most congestion and the highest number of crashes in the state. Yet congestion worsens during holiday periods due to last-minute Christmas shopping between December 22nd and 24th, frantically busy airport activity, and additional holiday traffic due to those using the I-75/85 as part of their route to other parts of the country. These factors mean Christmas and New Year in Georgia are just as dangerous as Thanksgiving.
Other notably busy Georgian routes include the following.
- I-75 south of Atlanta near Stockbridge is a recurring bottleneck for outbound and inbound Thanksgiving and Christmas traffic.
- I-85 northeast of Atlanta (Gwinnett / DeKalb) experiences sustained congestion during holiday periods due to commuter and interstate through-traffic.
- I-85 southwest and I-185 toward Alabama experience heavy delays as a west Georgia holiday corridor.
- I-20 eastbound into Atlanta clogs up early in the holiday week as drivers head toward the metro and beyond.
- I-20 westbound toward Alabama slows significantly after the holiday as drivers head home.
- I-95 near Savannah and Brunswick carries heavy holiday through-traffic between Florida and the Mid-Atlantic states, increasing congestion and crash exposure.
- I-285 (Atlanta Perimeter) effectively acts as a pressure valve for inner-city interstates, yet is still subject to predictable peak congestion during outbound and return windows.
- Airport corridors around Hartsfield–Jackson Atlanta International Airport suffer from congested passenger drop-offs, pickups, and rideshare traffic during Thanksgiving and the winter holidays.
Thanksgiving Weekend: A Reality Check
Thanksgiving Weekend is, on the whole, a dangerous period. But to fully appreciate risk over the Thanksgiving Weekend, both nationally and in Georgia, a number of factors must be considered.
Thanksgiving Day is actually less dangerous than a typical Thursday. That’s true in Fulton County, just as it’s also true nationally
Firstly, national FARS data clearly tells us that Thanksgiving Weekend is significantly more dangerous than Christmas Weekend. Between 2018 and 2022, there were 2,456 recorded traffic deaths over Thanksgiving, compared to 1,662 over Christmas.
Yet, Thanksgiving is the busiest travel period of the year, its traffic volume much higher than during Christmas, and represents a much more condensed (effectively five-day) period of time, with a pre- and post-holiday compressed surge of traffic that Christmas at no point replicates.
There are other mitigating factors, with risky driving behaviors spiking during Thanksgiving. These include a 10%+ increase in phone handling, an 11% increase in speeding, and a 13% increase in hard braking, with drunk driving also on the rise (38% of holiday fatalities involve impaired drivers) compared to non-holiday days.
Congestion also increases by up to 50% in major metro areas, exacerbated by Black Friday-related shopping traffic (Black Friday) that creates tailbacks around malls and creates additional crash environments.
And it’s important to note: Thanksgiving Day is actually less dangerous than a typical Thursday. That’s true in Fulton County, just as it’s also true nationally. In Fulton, Thanksgiving Thursday is the least dangerous day of all days across the Thanksgiving holiday, largely due to distinctly less traffic on the roads.
Overall, the Thanksgiving period is a dangerous one, with data confirming it as the second-deadliest holiday after Labor Day, slightly ahead of Memorial Day. It’s also the deadliest holiday for pedestrians. But if we look at Fulton data, Thanksgiving is ranked pretty far down the list of most dangerous holiday periods, as most of the holiday’s key danger occurs both before and after the event.
So, to fully understand Thanksgiving danger, it may depend entirely on where you are, what piece of data you’re looking at, or how you’re measuring the holiday period. As this study clearly establishes, Thanksgiving Day itself is not especially dangerous. As long as you remain mindful of where the danger lies during the full Thanksgiving period (primarily Wednesday and Sunday), plus which roads to avoid and when to avoid them, you stand a good chance of enjoying a great holiday.
At The Millar Law Firm, we fully understand the kind of problems that can so easily arise over the holiday period. If you’re injured in a crash in or near Atlanta, we can help protect you, your family, and your finances. The Millar Law Firm’s car crash attorneys are an award-winning legal team that will immediately explain your rights, offer legal advice, help find ways to cover your medical care expenses, recover your lost wages, and secure full compensation for your pain and trauma.